Efficient, innovative and time-saving diagnosis
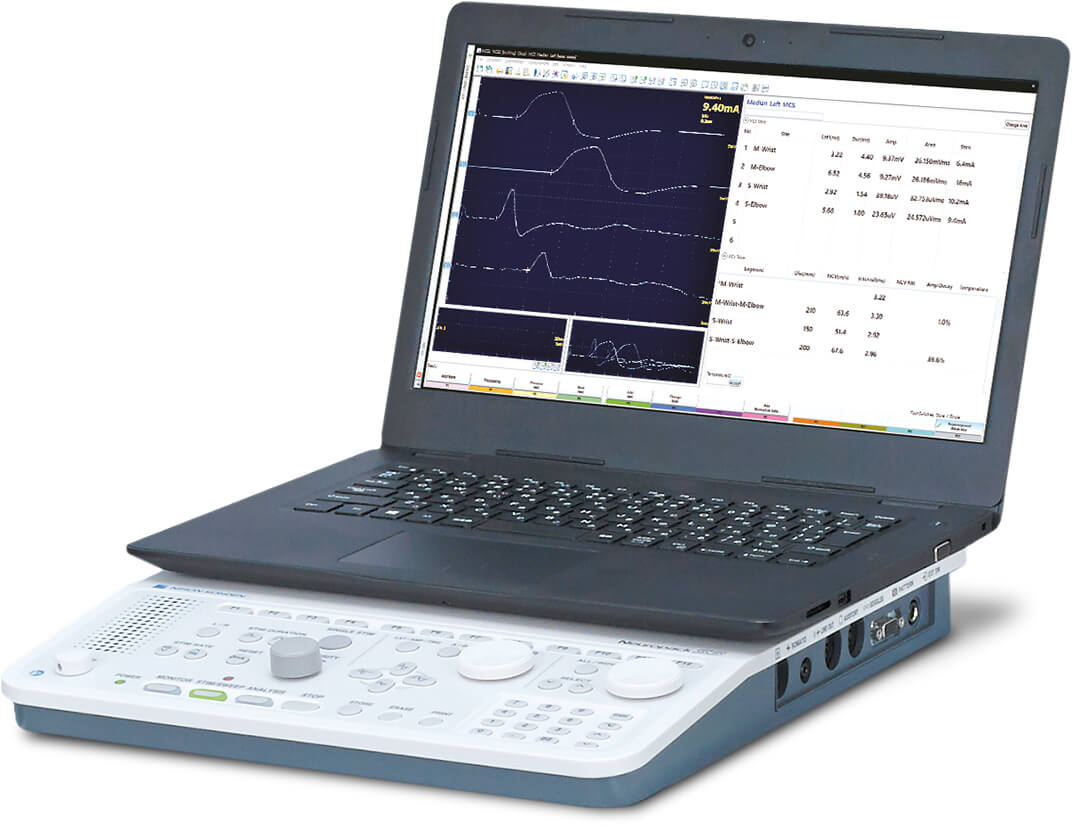
Nihon Kohden’s Neuropack S3 offers efficient and easy EMG, NCS and EP examinations with innovative time-saving technology. It is available in two or four-channel amplifier variants, supported by either desktop or notebook configurations. The main unit with a new design helps you to complete your daily routines in a much smoother way.
For decades, Nihon Kohden has been striving to be the one who understands your routine and complex clinical EMG/EP examination needs best. The Neuropack S3 measurement system is built to cover all aspects of diagnostics, delivering innovative functionality, high signal quality, and durability to ensure efficiency – all while remaining simple to use.
Low noise, compact amplifier
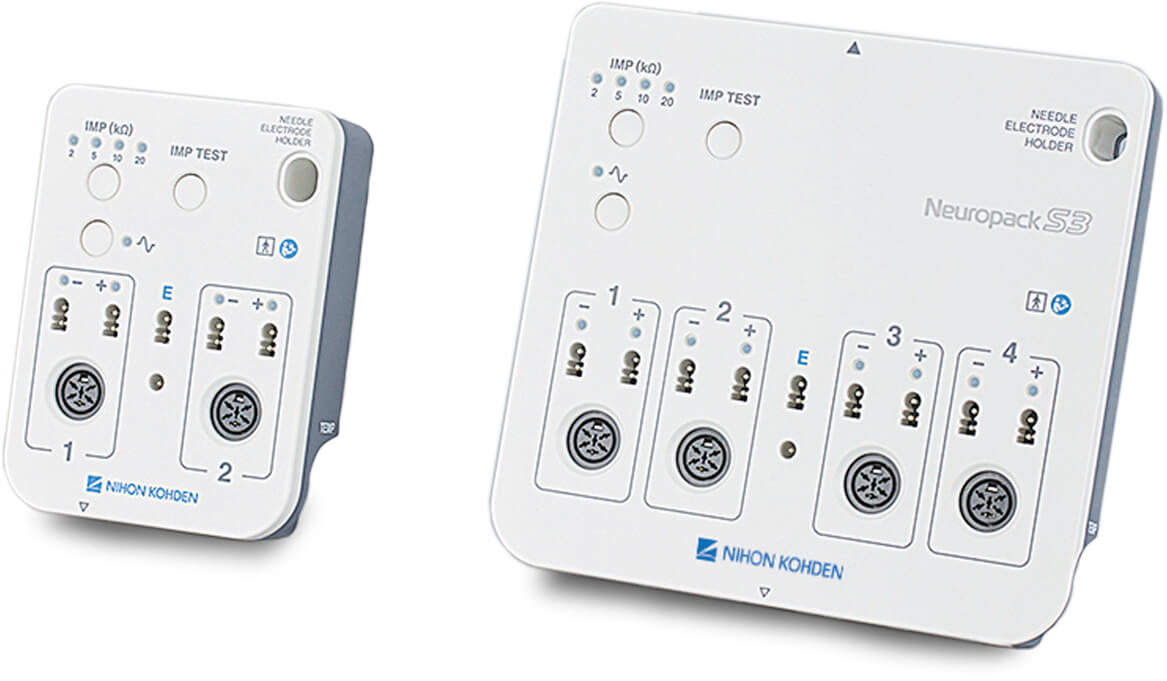
The compact state-of-the-art electrode junction box allows for easy mobility facilitating use in various places such as wards, examination rooms, offices, and laboratories. The low-noise amplifier, with 18-bit A/D converters, speeds up the examination by providing clean waveforms easily and quickly. The integrated impedance check, which can be activated directly on the electrode junction box, ensures reliable placement of electrodes.
NeuroNavi
The new and improved NeuroNavi onscreen examination guide provides examination information, electrode, and stimulation positions for NCS and other examinations. By including technical and physiological background information, the NeuroNavi goes way above the typical obligatory operation manual. Onscreen operation manuals are also available. You can refer to the NeuroNavi and operation manuals at any time.
User-friendly control panel
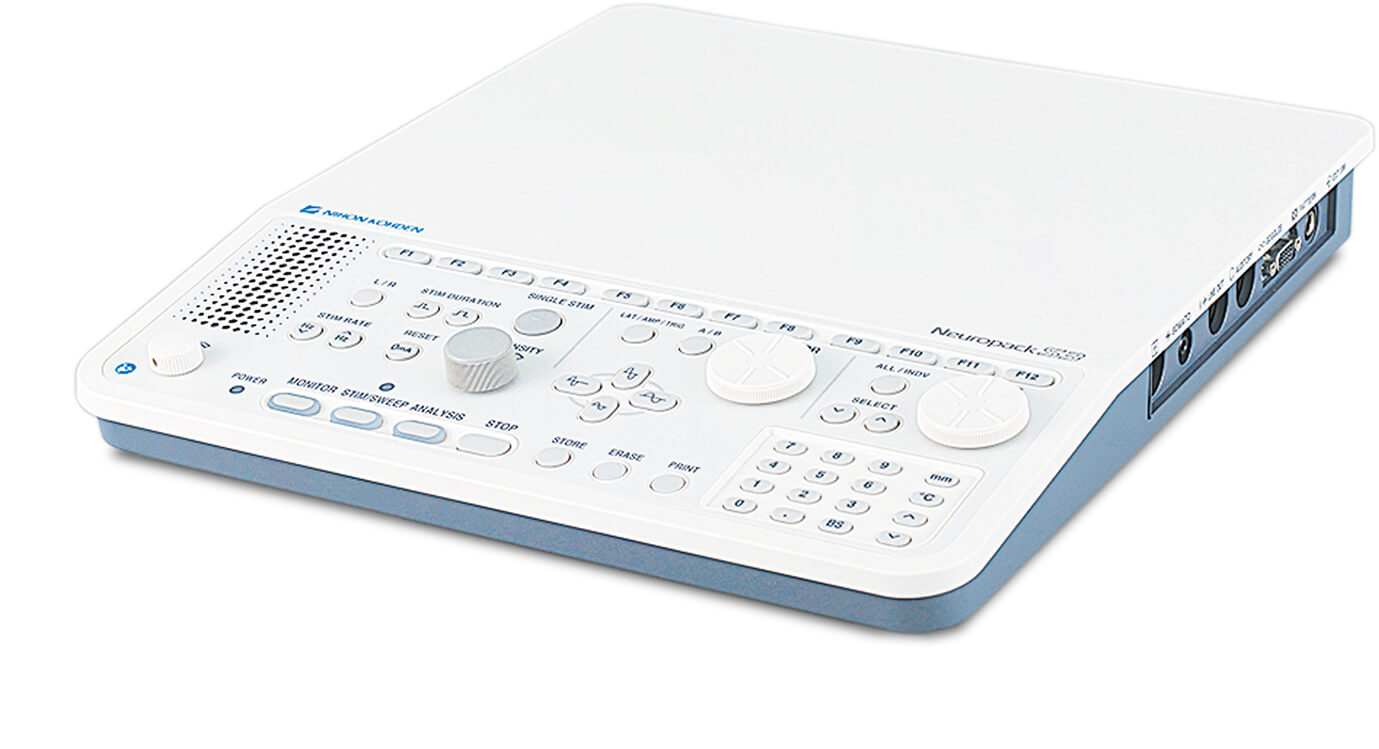
The simple and easy-to-use control panel allows for a smooth examination workflow. You can change the electric stimulation duration and rate with easy, one-touch operation. The large main operation buttons of the Neuropack series have proven successful in many previous product generations. This concept has been further enhanced by providing dedicated buttons negating the need to make use of the computer keyboard or mouse during an examination.
iSAF Intelligent Stimulus Artifact Filter
Always struggling to acquire clean waveforms free of stimulus artifacts? Nihon Kohden’s new breakthrough mathematical signal processing technology, iASF, provides an excellent solution for electrical stimulus artifacts.
Reporting
NeuroReport is the common reporting tool for all EEG, EMG, and IOM systems provided by Nihon Kohden. Various predefined templates can be used to create customized reports for different examination types. A powerful auto-text function enables the creation of individual reports. The reports that are saved within the database (in a license-free format) will automatically be converted to PDF after finalizing. This prevents those important medical documents from being tampered with and makes them available in a universal format as well.
Multitasking window
Up to eight test protocol windows can be opened simultaneously, thus making it easy to revisit previous steps of the examination series. The examination list is your central navigation portal during and after the examination and allows you to easily track the status of the examination series.
Standard examination programs
Electromyography
The routine EMG program utilizes auto MUP detection and classification with real-time turns/amp analysis. A functional and sophisticated findings screen meets various needs in clinical use thanks to its simple and smooth operation.
- Quick display: You can easily switch between four measurement modes, that can be easily defined – for example for insertion activity, motor unit detection, or turn / amplitude analysis, or interference – by pressing a button at the bottom of the screen or on the control panel.
- MUP: MUP waveforms are automatically detected and classified into groups of similarly shaped MUPs. MUP measurement results (duration, amplitude, phase, turns, and firing rate) are shown next to the waveforms or on a dedicated summary screen. The average MUP of the same MUP groups is calculated and displayed with the numeric data.
- Trigger EMG: A cascading waveforms window displays the waveforms that are triggered by either level trigger, window trigger, or rise time trigger in chronological order. You can change the duration (beginning and ending point of MUP). Up to eight new sequential MUP waveforms are displayed on the MUP sweep window without scrolling. You can easily select the waveforms by the use of a button.
- Interference: Turns / amplitude measurement is automatically performed. The measurement result is displayed every second on the turns-interval histogram, turns / amp histogram, and turns / amp graph. The turns / amp normative data of several muscles is installed as default settings and its normative area is displayed in the turns / amp histogram. You can easily recognize whether the measuring waveforms are in the normative range or not.
- Muscle summary: The summary window (muscles) is the best place to start typing the EMG findings – right next to the results of the examination. The latest EMG findings screen displays up to 26 waveform traces with annotations in the MONITOR waves window and up to 20 MUP waveforms in the MUP window, on one screen, for efficient and quick EMG evaluation.
- EMG playback software: You can also easily review any acquired waveform with sound after measurement by clicking the EMG player button. This tool also lets you play back EMG files, including sounds, on a review station for presentations and lectures.
Neurography
- Nerve Conduction Study (NCS): The NCS program lets you perform MCS, SCS, and F-wave examinations in one program.
- Motor NCS/sensory NCS: When measuring with the Neuropack S3, there is no need to manually pick the stimulation site before starting the recording. The software provides this automatically but if necessary, it is simple to change this configuration. Side comparisons and combined motor and sensory tests can be displayed on one waveform screen and also have their own dedicated evaluation tables. Normative data is available on the same screen. The superimposed waveform is displayed, in real time, allowing you to easily compare the amplitudes of all stimulation sites thereby having the ability to judge the quality of the stimulation.
- Repetitive stimulation: The amplitude of each sequence is displayed as a bar graph on the same screen. The summary of the repetitive stimulation study can be easily viewed at a glance. The waveform of each sequence can be displayed by clicking the corresponding bar graph. Up to twelve stimulation pattern sequences can be set for one automatic measurement (automatic sequence function). Stimulation can be delivered at either high or low frequency, as well as a combination of both, in the same protocol.
- F-wave: With the dual sensitivity function, both M- and F-waves are displayed with proper amplification. F-wave latency is displayed in the F-wave histogram window.
- H-reflex: The intensity-amplitude graph and superimposed waveforms are displayed in the same window.
- Blink-reflex: The relation between the mark position and the normative range is easy to identify in the blink measurement window.
Somatosensory Evoked Potentials
Standard SEP examination protocols range from SSEP to ESCP.
- ECG artifact-free SSEP: With the ECG-SSEP protocol, stimulation and averaging is done during the flat period of the ECG waveform allowing for the recording of artifact-free waveforms.
- Signal triggering and back averaging: Cortical potentials prior to muscle contraction can be recorded by using a rectified EMG signal trigger and back-averaging.
- Simultaneous SSEP and SEP measurement: Upper and lower extremity measurements can be conducted at the same time on the same screen.
- Side comparison: Split screen display allows for side comparisons on the same screen.
Somatosensory Evoked Potentials
Visual Evoked Potentials
- Variety of visual stimulations: A monitor for pattern reversal, LED goggles and flash stimulator options allow for complete visual testing.
- EOG velocity waveform display: With the integrated differential amplifier, the velocity waveform can simultaneously be displayed along with the original EOG signal.
AEP: Standard AEP examination protocols are
- ABR (auditory brainstem response)
- MLR (middle latency response)
- SVT (slow vertex response)
- EcochG (electrocochleogram)
- ABR auto marking: In the ABR protocol, automatic waveform marking allows time-saving measurement of latency, amplitude, and interval.
- Automatic separation of AP and CM waveforms: In EcochG examination, AP and CM can be automatically separated from the original waveforms in real-time. The original, AP and CM, waveforms are simultaneously displayed on the screen.
- Simultaneous ABR and MLR: ABR and MLR can be measured simultaneously on the same screen.
Automatic nerve system testing
- R-R interval: For the heart rate variability testing, the rate variations can be evaluated by either FFT or MEM analysis in addition to the classic sequential evaluation.
- SSR: Sympathetic skin response measures potential change of the skin which is evoked by somatosensory, auditory, or visual stimulation. Up to 9,999 evoked waveforms can be temporarily saved in memory.
Single Fibre and Macro EMG
Jitter reanalysis is possible at different trigger levels for all acquired waveforms. MCD, MSD, MIPI, firing rate, and blocking can be automatically analyzed. Two single fibre modes are available – voluntary contraction and stimulation.
Data integration and management
- Polaris.one: The software allows you to easily manage data and examination schedules
- SQL-based database for EEG, EMG/EP, and ECG data
- The user interface can be scaled according to user needs, for example by removing unnecessary buttons or selecting the data to be displayed
- Calendar view and to-do lists
- Copies of data can be stored for personal or global use while still being managed by the database
- Auto-proposing for text input fields
- Manual, semi-automatic, and automatic transfer and archive as background service
- Integrated NeuroReport, featuring a multitude of templates for all examinations
- Offline functionality for acquisition and review stations, making your workflow immune to network communication losses at any time
- Multi-client-capability with user-related filtering of patients
- Extensive user rights management (via groups)
- Activity log records all changes to medical data
- Integrated DVD/CD burning
Optional examination program
Visual Evoked Potentials
- Variety of visual stimulations: A monitor for pattern reversal, LED goggles and flash stimulator options allow for complete visual testing.
- EOG velocity waveform display: With the integrated differential amplifier, the velocity waveform can simultaneously be displayed along with the original EOG signal.
AEP: Standard AEP examination protocols are:
- ABR (auditory brainstem response)
- MLR (middle latency response)
- SVT (slow vertex response)
- EcochG (electrocochleogram)
- ABR auto marking: In the ABR protocol, automatic waveform marking allows time-saving measurement of latency, amplitude, and interval.
- Automatic separation of AP and CM waveforms: In EcochG examination, AP and CM can be automatically separated from the original waveforms in real-time. The original AP and CM waveforms are simultaneously displayed on the screen.
- Simultaneous ABR and MLR: ABR and MLR can be measured simultaneously on the same screen.
Automatic nerve system testing
- R-R interval: For the heart rate variability testing, the rate variations can be evaluated by either FFT or MEM analysis in addition to the classic sequential evaluation.
- SSR: Sympathetic skin response measures potential change of the skin which is evoked by somatosensory, auditory, or visual stimulation. Up to 9,999 evoked waveforms can be temporarily saved in memory.
Single Fibre and Macro EMG
Jitter reanalysis is possible at different trigger levels for all acquired waveforms. MCD, MSD, MIPI, firing rate, and blocking can be automatically analyzed. Two single fibre modes are available – voluntary contraction and stimulation.
Data integration and management
- Polaris.one: The software allows you to easily manage data and examination schedules
- SQL-based database for EEG, EMG/EP, and ECG data
- The user interface can be scaled according to user needs, for example by removing unnecessary buttons or selecting the data to be displayed
- Calendar view and to-do lists
- Copies of data can be stored for personal or global use while still being managed by the database
- Auto-proposing for text input fields
- Manual, semi-automatic, and automatic transfer and archive as background service
- Integrated NeuroReport, featuring a multitude of templates for all examinations
- Offline functionality for acquisition and review stations, making your workflow immune to network communication losses at any time
- Multi-client-capability with user-related filtering of patients
- Extensive user rights management (via groups)
- Activity log records all changes to medical data
- Integrated DVD/CD burning